class: center, middle, inverse, title-slide # Moving Beyond the Basics in MDM4U ## Data Management ### Chris Papalia ### St. Andrew’s College ### Original - 2017-05-17 <br> (updated: 2021-03-16) <br><br> Resources Available here: <a href="http://bit.ly/BeyondBasicsMDM4U">http://bit.ly/BeyondBasicsMDM4U</a> <br><br> Personal Website: <a href="http://highschoolteach-r.netlify.com/">http://highschoolteach-r.netlify.com/</a> --- layout: true background-image: url(SAC RGB Logo EST 1899.jpg) background-position: 50% 100%; background-size: 10% --- layout: true background-image: url(SAC_Logo_1899.jpg) background-position: 5% 100% background-size: 15% --- # Chris Papalia #### Education Background - B.A. Physics - [Macalester College](https://www.macalester.edu/), 2007 - B.Ed. Mathematics and Physics - [University of Toronto/OISE](https://www.utoronto.ca/), 2009 - M.Ed. Curriculum, Teaching, Learning - [University of Toronto/OISE](https://www.utoronto.ca/), 2018 -- #### Professional Background - [Durham District School Board](https://www.ddsb.ca/en/index.aspx) 2009 – 2012 - [St. Andrew’s College](www.sac.on.ca) 2012 – Present -- #### Interests - Teaching Statistics - Data Science and Analytics in R - Tech Integration into Teaching - Online Learning - Coaching Hockey and Baseball and Squash ??? I am fortunate to have access to many resources, but in teaching in public schools for three years, I still believe that much of what I do now can be done in many schools. --- background-image: url(SAC_campus.jpg) background-size: cover class: inverse, middle, center # St. Andrew's College --- # Outline -- ### 1. History -- a. Know your audience -- b. How I started teaching MDM4U -- ### 2. How I am changing -- a. Order of Units -- b. Context with Books/Media/Podcasts -- c. Spiral Topics -- d. Tech/Visualization/(coding?) -- e. Assessing with projects --- # Who Takes Data Management? -- ### Students say... -- - “I need a grade 12 math” -- - “Calculus and Advanced Functions are too hard” -- - “I’m not a math person” -- - “I don’t need math…” -- - “Guidance said this is the math class for me” --- background-image: url(https://images-na.ssl-images-amazon.com/images/I/41XZVHND-aL.jpg) background-size: contain class: inverse, center, middle # Who Teaches Data Management? -- .left[Those who...] -- .right[...can't teach calculus?] --- background-image: url(https://images.unsplash.com/photo-1594107208769-c8fa1d758102?ixid=MXwxMjA3fDB8MHxzZWFyY2h8OXx8b3ZlcndoZWxtZWR8ZW58MHx8MHw%3D&ixlib=rb-1.2.1&auto=format&fit=crop&w=500&q=60) background-size: cover # My first time teaching MDM... --- background-image: url(https://images.unsplash.com/photo-1453728013993-6d66e9c9123a?ixid=MXwxMjA3fDB8MHxzZWFyY2h8Mnx8b3Bwb3J0dW5pdHl8ZW58MHx8MHw%3D&ixlib=rb-1.2.1&auto=format&fit=crop&w=500&q=60) background-size: cover class: inverse, center, top # Teaching MDM is an opportunity... --- background-image: url(https://images.unsplash.com/photo-1542378135-815e52392963?ixid=MXwxMjA3fDB8MHxzZWFyY2h8MTN8fGpvdXJuZXl8ZW58MHx8MHw%3D&ixlib=rb-1.2.1&auto=format&fit=crop&w=500&q=60) background-size: cover class: inverse, center # My Journey --- background-image: url(https://images.unsplash.com/photo-1542378135-815e52392963?ixid=MXwxMjA3fDB8MHxzZWFyY2h8MTN8fGpvdXJuZXl8ZW58MHx8MHw%3D&ixlib=rb-1.2.1&auto=format&fit=crop&w=500&q=60) background-size: cover class: inverse, center # My Journey .left[ ## When I started.... Student's were calculating the standard deviation by hand Using a TI-83+ was considered tech We rarely discussed data in the wild ] -- .right[ ## But now that I've taught this more... We are using software to perform calculations and visualization We spend most of our time interpreting statistical outputs and telling stories with data visualization ] --- class: center, middle # The Data tells a story... --- background-image: url(Graphs.jpg) background-size: cover class: center, middle # The Data tells a story --- background-image: url(https://images.unsplash.com/photo-1568236700632-c0cfc08f486a?ixid=MXwxMjA3fDB8MHxzZWFyY2h8OHx8bWVjaGFuaWN8ZW58MHx8MHw%3D&ixlib=rb-1.2.1&auto=format&fit=crop&w=500&q=60) background-size: cover class: inverse, middle # How did I change my practice? --- # Organized a New Course Plan #### 1. One Variable Data – “What’s the data say?” - Distributions and Statistics (shape, centre, spread) #### 2. Normal Distributions and Standardized Scores - "How do we compare individuals"? #### 3. Two Variable Data – “What else is at play?” #### 4. Data Collection – “What say do we have in the data?” #### 5. Probability – “How likely is the data” - Counting, permutations, combinations #### 6. Probability Applications and Distributions "How can I win with data?" #### 7. Special Topics in Data "How do I apply these skills" --- # Enrich the Classroom with Tools - ### Laptop, Projector, Live Data Analysis - ### Simulations, Excel, Fathom, RStudio - ### We try to work with data visualization every day - ### Remember, a good plot tells the story --- class: center, middle # Add context --- background-image: url(context.jpg) background-size: cover class: center, middle # Add context --- class: center # Specific Improvements -- .pull-left[ ### 1. Spiraling Content/Adding context Always revisiting one/two variable data and looking ahead and behind ] -- .pull-left[ ### 2. Using tools that are accessible to students Data Visualization with meaningful data Low floor; High ceiling ] -- .pull-left[ ### 3. Using applets, discussion forums, and teaching videos Recording class lessons Student discussions ] -- .pull-left[ ### 4. Using AP Statistics Resources Free-Response Questions that will connect several course topics Model answers and rubrics available for students ] --- background-image: url(https://images.unsplash.com/photo-1533105320376-1b9894a4af15?ixid=MXwxMjA3fDB8MHxzZWFyY2h8MTJ8fGNvbm5lY3Rpb258ZW58MHx8MHw%3D&ixlib=rb-1.2.1&auto=format&fit=crop&w=500&q=60) background-size: cover class: inverse, middle # Adding Context and Connecting Topics --- # Data, Probability, and Stories -- .pull-left[ Chapter 2: Probability - Natural Variability - Birthday and Monty Hall Problem - Statistics and Probability - Written with excellent prose and narrative ] -- .pull-right[ The Creator of [Gapminder](https://www.gapminder.org/) Data is available to reproduce these plots and Hans Rosling shares with us the stories these data tell] --- # Expected Values, Probability, and Decisions -- .pull-left[ The book describes decision making in baseball and outlines expected run probability and decision-making.] -- .pull-right[] --- # Podcasts For Context -- [What Can Uber Teach us About the Gender Pay Gap?](https://freakonomics.com/podcast/what-can-uber-teach-us-about-the-gender-pay-gap/) .pull-left[] -- .pull-right[ - Study Design Principles - Exploring the Gender Pay Gap - "Explained Variance" and Modelling - Other podcasts exploring, research, statistics, economics, and social science: [CBC 180 on Nosodes](https://www.cbc.ca/radio/the180/a-call-for-more-black-voices-in-white-media-hallucinogenic-drug-therapy-why-this-doctor-is-studying-nosodes-1.3794440/why-this-infectious-disease-expert-is-studying-nosodes-1.3794615) [Cautionary Tales](https://timharford.com/articles/cautionarytales/) [Probable Causation](https://www.probablecausation.com/) [TED Talks - Statistically Speaking](https://www.ted.com/playlists/479/statistically_speaking) ] --- # Introduction to Two-Variable Data [The Most Diverse Cities are Often the Most Segregated (fivethirtyeight.com)](https://fivethirtyeight.com/features/the-most-diverse-cities-are-often-the-most-segregated/) -- .pull-left[ ] -- .pull-right[ - Let's understand a scatterplot - Let's look at a regression model - Let's discuss the meaning of an index - Let's discuss multivariate thinking - Let's discuss how statistics, data, modelling play a role in society and policy ] --- # Experiments and Simulations - Coke vs Pepsi .pull-left[ This activity involves the following [Ministry Expectations](http://www.edu.gov.on.ca/eng/curriculum/secondary/math1112currb.pdf) and can be used to connect these topics throughout the academic year: A1.1, A1.3, A1.4, A2.2, B1.1, B1.2, B1.3, B1.4, B1.7, B2.2, B2.6, B2.8, C1.1, C1.2, C2.1, C2.4, D1.2, D1.3, D1.4 [AP-Statistics Design](https://apcentral.collegeboard.org/courses/ap-statistics/classroom-resources/coke-versus-pepsi-introductory-test-significance) [Coke Pepsi Design - Carelton College](https://serc.carleton.edu/sp/library/datasim/examples/cokepepsi.html) ] .pull-right[ [CODAP Visualization Link](https://codap.concord.org/app/static/dg/en/cert/index.html#shared=https%3A%2F%2Fcfm-shared.concord.org%2FZnTnsuJ2Jg9uyNkw3dzs%2Ffile.json) Other Examples of Simulations include: - Catch and Release Estimates - Cholesterol Reduction Activity - Chi-Squared Distributions ] --- background-image: url(Applet_Brown.jpg) background-size: contain class: inverse # Applets [Brown University - Seeing Theory](https://seeing-theory.brown.edu/index.html#firstPage) This applet contains interactive visuals and an [e-textbook](https://seeing-theory.brown.edu/doc/seeing-theory.pdf) that describes worked solutions. I find this especially helpful for Venn diagrams and permutations/combinations. --- class: inverse # Applets .pull-left[[Art of Statistics Web-Applets](https://artofstat.com/web-apps) Outstanding array of applets for every course topic. The visualizations are helpful for students to see simulations and sampling distributions and probabilities, and the apps include data. 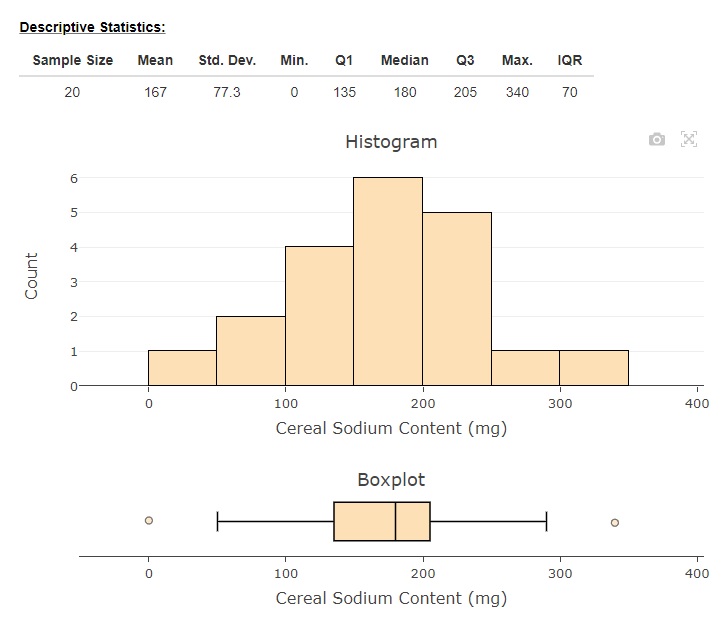 ] -- .pull-right[[Kristoffer Magnusson Applets](https://rpsychologist.com/viz/) These applets are slick and offer a look at visualizing specific features of statistics and inference and distributions. 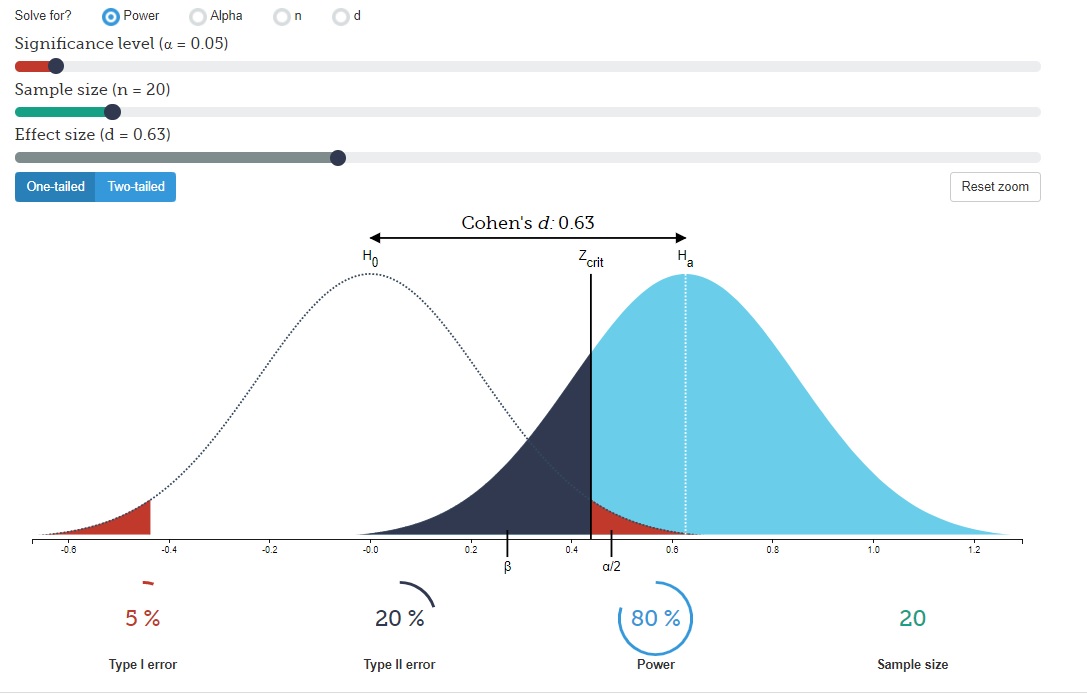 ] --- # Ask Good Questions -- .pull-left[ [Ask Good Questions - Blog](https://askgoodquestions.blog/about-me/) Allan Rossman, the inspiring former chief reader of the AP Statistics Program, encourages teachers to "ask good questions" for student learning. His blog is insightful, friendly, and encouraging to all. I have done several of his activities in my class. ] -- .pull-right[[The AP Statistics Exam Page](https://apcentral.collegeboard.org/courses/ap-statistics/exam/past-exam-questions?course=ap-statistics) This page offers all of the previous AP Free-Response Questions and Solution Rubrics. 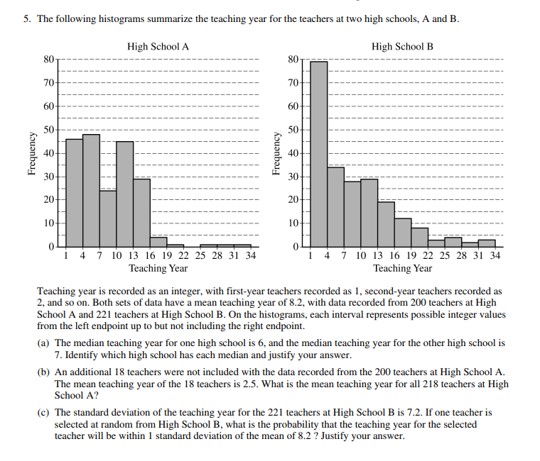 ] --- # Assessment Strategies -- .pull-left[ ### Formative Assessments (Unit) - Submissions of Plots (COVID, StatsCan, Two-Way Tables) - (Online) Discussion/Reflections on news articles or podcasts - Quizzes (MC, Interpreting Plots) - Group Presentations of Free Response Questions - Collaborative Board Work - Textbook Problems ] -- .pull-right[ ### Major Assessments - Find Data* - Test/Exams (MC/Free-Response) - Comparative Analysis with Software (1-Var)* - Individual Analysis with Software (Z-scores)* - Two Variable Modelling Investigation with Software (2-Var)* - Simple Games and Simulations* ] --- # Extend Understanding Using the RStudio Learning Community ### Use Data Science and RStudio to Develop Skills .pull-left[ I sometimes have students watch segments of [David Robinson analyze TidyTuesday Data](https://www.youtube.com/user/safe4democracy/videos) and explore some of it on their own. 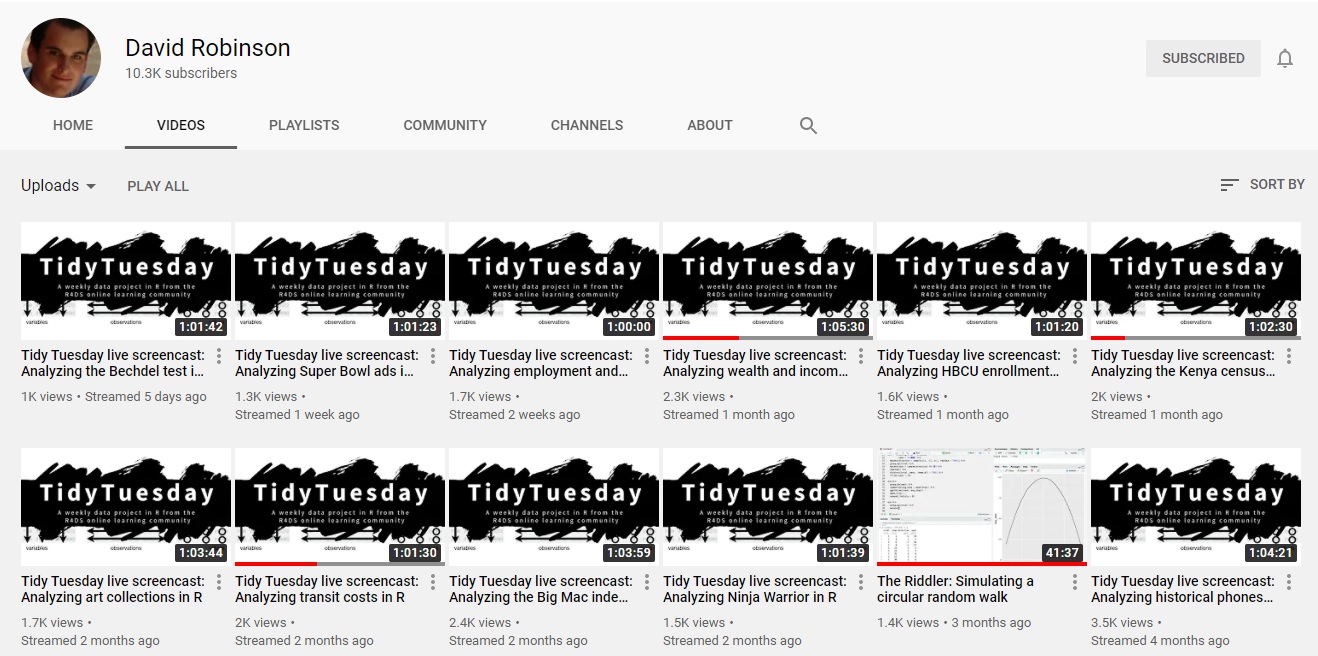 ] .pull-right[ I use the textbook [OpenIntro Statistics](https://www.openintro.org/book/ahss/) for class and do several examples in my own RStudio during class to demonstrate Exploratory Data Analysis. There are several resources offered through the [RStudio Education Website](https://education.rstudio.com/) using Rstudio cloud and the resources at [R for the Rest of Us](https://rfortherestofus.com/resources/) are helpful for further investigation. ] --- # Helpful Resources for Statistics Teachers Anything from [Dr. Mine Çetinkaya-Rundel](http://www2.stat.duke.edu/~mc301/) although she focuses on introductory college-level instruction. The [Stats Medic](https://www.statsmedic.com/) and [Skew the Script](https://skewthescript.org/) are free and offer lesson templates and plans to follow including discussion topics. [Amy Hogan's blog](http://alittlestats.blogspot.com/) on teaching statistics has several tips from an experienced statistics teacher. The [AP Statistics YouTube Playlist](https://www.youtube.com/playlist?list=PLoGgviqq4845u-QDW3bikMhC4uQsuYDpy) offers video instruction of some key topics in the AP-Statistics Curriculum. The New York Times Learning Network features [What's Going On in This Graph?](https://www.nytimes.com/2020/06/10/learning/over-60-new-york-times-graphs-for-students-to-analyze.html) which features a graph and provides lesson and discussion forums for its interpretation. The ASA produced a [Guidelines for Assessment and Instruction in Statistics Education II: A Framework for Statistics and Data Science Education report (GAISE II)](https://www.amstat.org/asa/education/Guidelines-for-Assessment-and-Instruction-in-Statistics-Education-Reports.aspx). --- layout: false --- class: inverse, center, middle # Thank You! Chris Papalia <a href="mailto:chris.papalia@sac.on.ca"> </i> chris.papalia@sac.on.ca</a> [highschoolteach-r.netlify.com](http://highschoolteach-r.netlify.com/)