Data, Probability, and Stories

Chapter 2: Probability
- Natural Variability
- Birthday and Monty Hall Problem
- Statistics and Probability
- Written with excellent prose and narrative
Data, Probability, and Stories
Chapter 2: Probability
- Natural Variability
- Birthday and Monty Hall Problem
- Statistics and Probability
- Written with excellent prose and narrative

The Creator of Gapminder
Data is available to reproduce these plots and Hans Rosling shares with us the stories these data tell
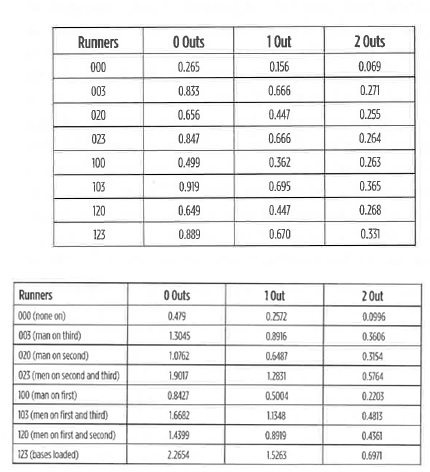
Expected Values, Probability, and Decisions
 The book describes decision making in baseball and outlines expected run probability and decision-making.
Expected Values, Probability, and Decisions
The book describes decision making in baseball and outlines expected run probability and decision-making.
Podcasts For Context
What Can Uber Teach us About the Gender Pay Gap?
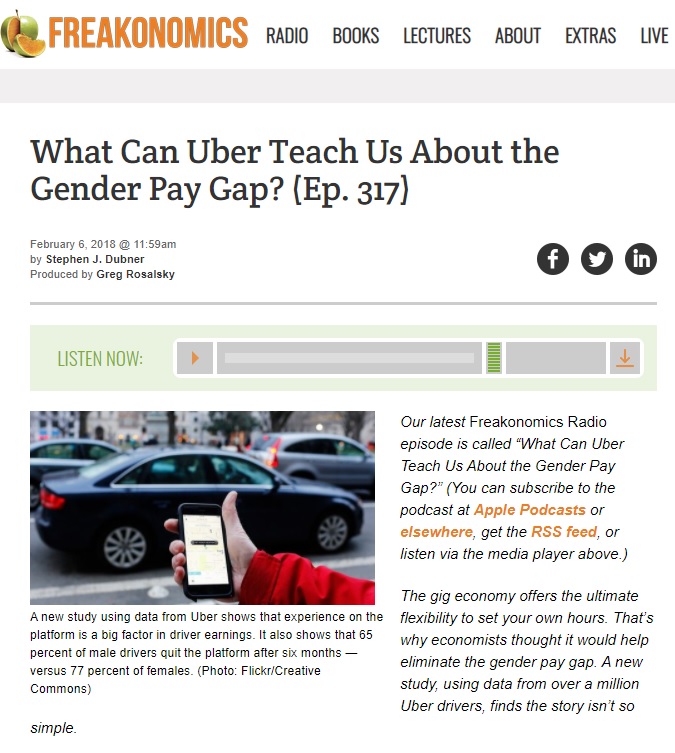
Study Design Principles
Exploring the Gender Pay Gap
"Explained Variance" and Modelling
Other podcasts exploring, research, statistics, economics, and social science:
Introduction to Two-Variable Data
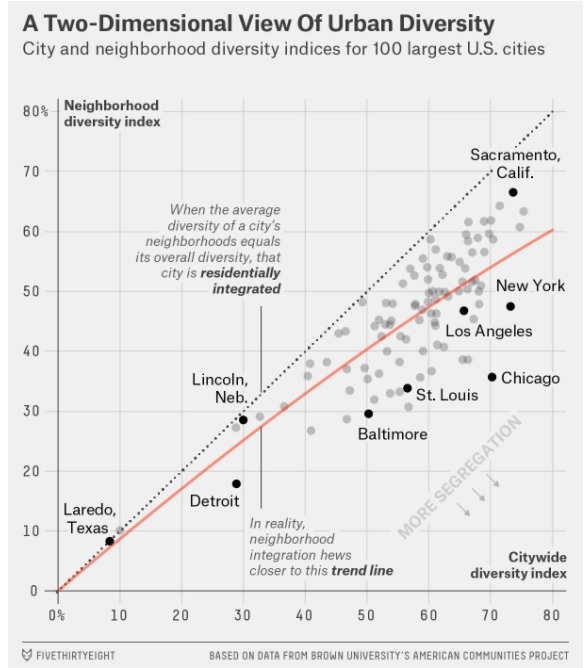
The Most Diverse Cities are Often the Most Segregated (fivethirtyeight.com)
Introduction to Two-Variable Data
The Most Diverse Cities are Often the Most Segregated (fivethirtyeight.com)
Let's understand a scatterplot
Let's look at a regression model
Let's discuss the meaning of an index
Let's discuss multivariate thinking
Let's discuss how statistics, data, modelling play a role in society and policy
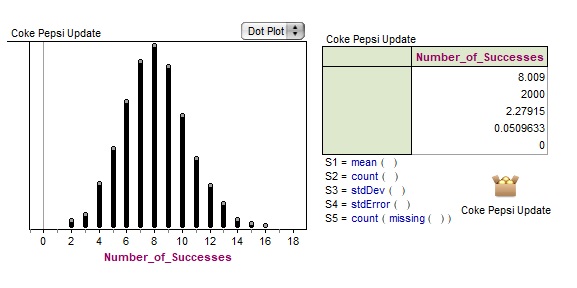
Experiments and Simulations - Coke vs Pepsi
This activity involves the following Ministry Expectations and can be used to connect these topics throughout the academic year:
A1.1, A1.3, A1.4, A2.2,
B1.1, B1.2, B1.3, B1.4, B1.7, B2.2, B2.6, B2.8,
C1.1, C1.2, C2.1, C2.4,
D1.2, D1.3, D1.4
Other Examples of Simulations include:
- Catch and Release Estimates
- Cholesterol Reduction Activity
- Chi-Squared Distributions
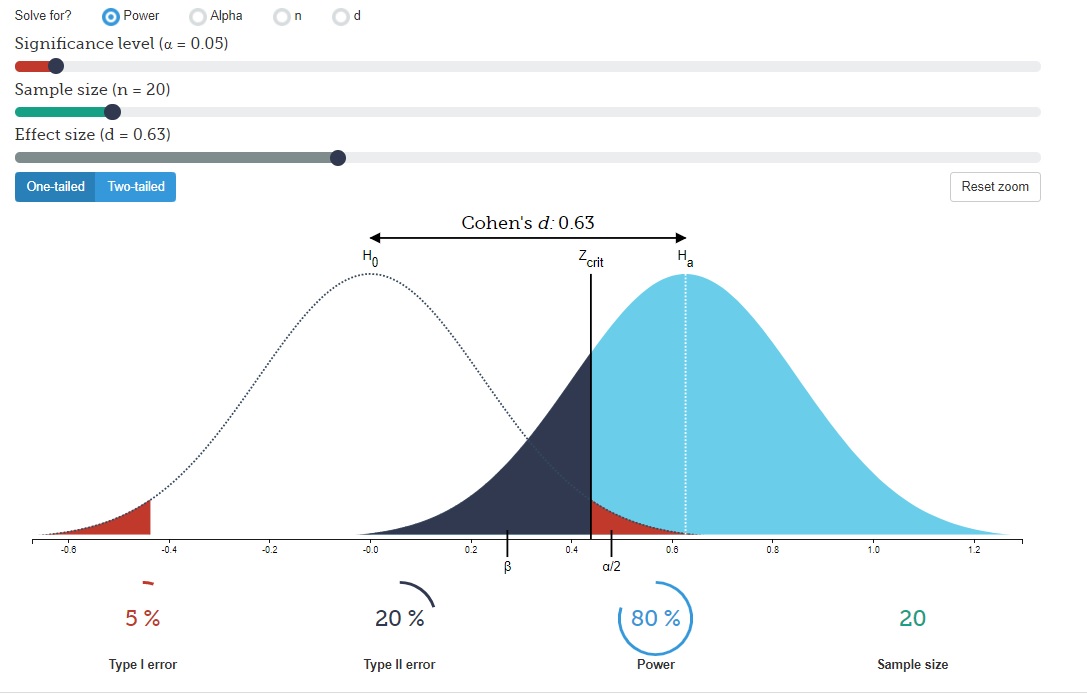
Applets
Outstanding array of applets for every course topic. The visualizations are helpful for students to see simulations and sampling distributions and probabilities, and the apps include data.
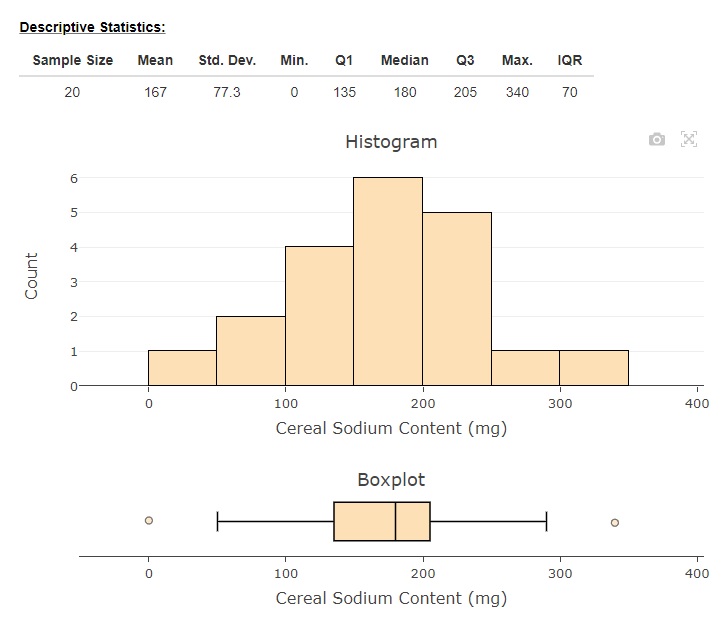
Applets
Outstanding array of applets for every course topic. The visualizations are helpful for students to see simulations and sampling distributions and probabilities, and the apps include data.
These applets are slick and offer a look at visualizing specific features of statistics and inference and distributions.
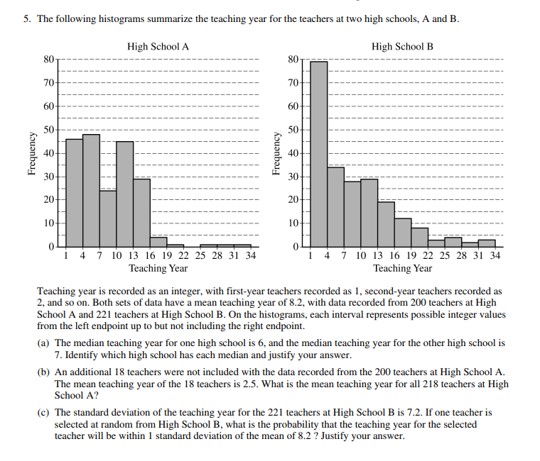
Ask Good Questions
Allan Rossman, the inspiring former chief reader of the AP Statistics Program, encourages teachers to "ask good questions" for student learning. His blog is insightful, friendly, and encouraging to all. I have done several of his activities in my class.
This page offers all of the previous AP Free-Response Questions and Solution Rubrics.
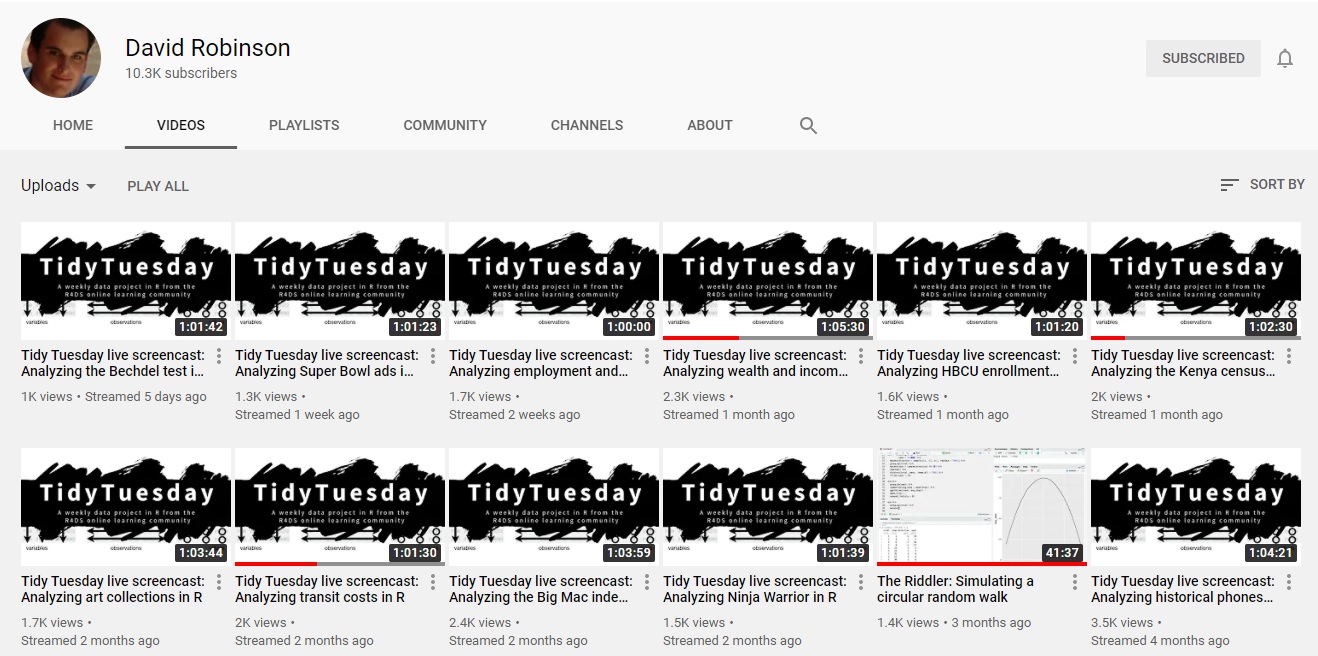
Extend Understanding Using the RStudio Learning Community
Use Data Science and RStudio to Develop Skills
I sometimes have students watch segments of David Robinson analyze TidyTuesday Data and explore some of it on their own.
I use the textbook OpenIntro Statistics for class and do several examples in my own RStudio during class to demonstrate Exploratory Data Analysis.
There are several resources offered through the RStudio Education Website using Rstudio cloud and the resources at R for the Rest of Us are helpful for further investigation.